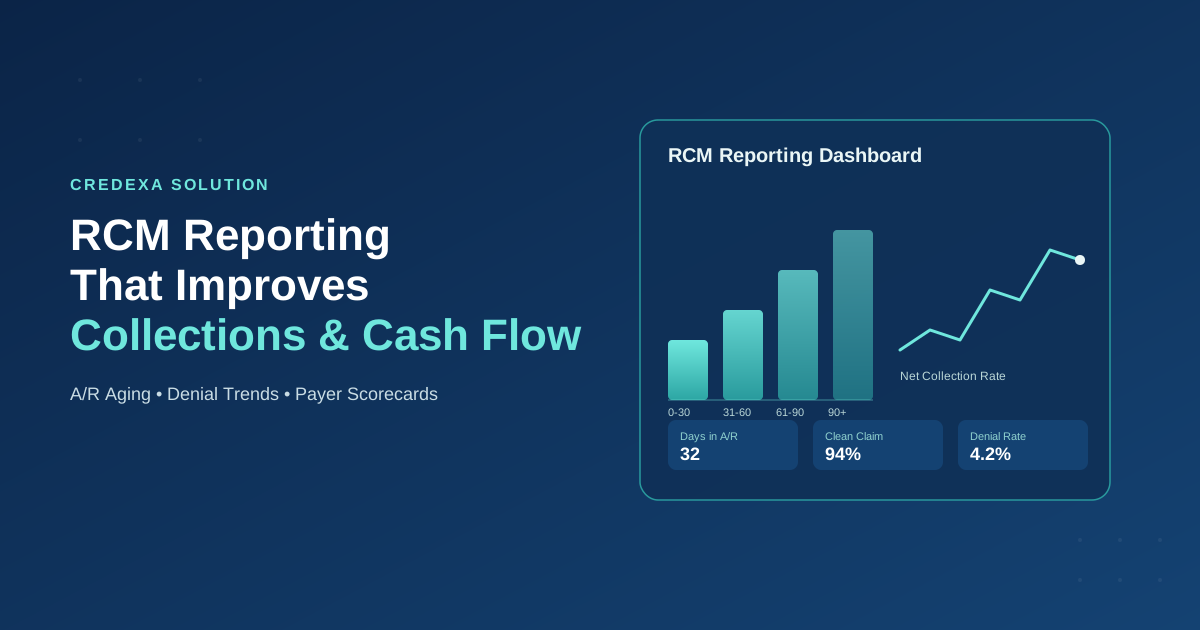
Every medical practice eventually asks the same question: “We’re seeing patients and submitting claims so why isn’t the money showing up?”
The answer almost never lives in a single spreadsheet or a single denied claim. It lives inside your revenue cycle management (RCM) reporting — or the lack of it. Practices that don’t measure their revenue cycle in detail are, in effect, flying blind: they can tell you they had a “slow month,” but they can’t tell you why, where the money is stuck, or what to fix first.
At Credexa Solution, we work with providers who come to us with the exact same symptoms rising accounts receivable, unpredictable cash flow, and a billing team that’s busy but not necessarily effective. In almost every case, the root cause isn’t a lack of effort. It’s a lack of visibility. And visibility is exactly what strong RCM reporting delivers.
This guide breaks down what RCM reporting actually is, the specific reports that move the needle on collections, how to read them like a financial diagnostic tool, and how a reporting-driven revenue cycle can turn unpredictable income into a stable, forecastable cash flow — month after month.
Table of Contents
- What Is RCM Reporting, Really?
- Why Collections and Cash Flow Break Down Without Reporting
- The Hidden Cost of “Reporting Blind Spots”
- The Core RCM Reports Every Practice Should Track
- Coding Accuracy: The Reporting Layer Most Practices Ignore
- Denials, Timely Filing, and the Reports That Catch Them Early
- Turning Reports Into a Repeatable Collections Strategy
- Dashboards, Automation, and the Future of RCM Reporting
- Benchmarks: What “Good” Actually Looks Like
- Specialty-Specific Reporting: Why One Dashboard Rarely Fits Every Practice
- Common RCM Reporting Mistakes That Quietly Drain Revenue
- How Credexa Solution Builds Reporting Into Your Revenue Cycle
- Conclusion
- Frequently Asked Questions
1. What Is RCM Reporting, Really?
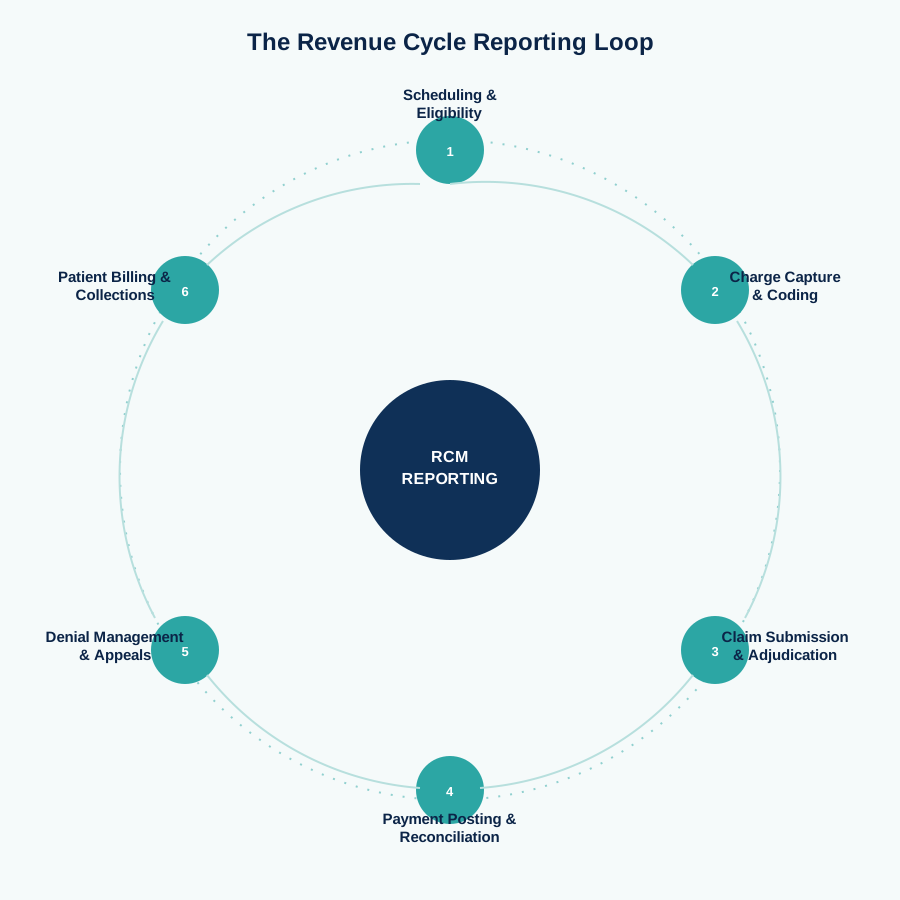
Revenue cycle management reporting is the ongoing measurement of every financial touchpoint in a patient’s journey from the moment an appointment is scheduled to the moment the final dollar is collected. That includes:
- Patient registration and eligibility verification
- Charge capture and coding
- Claim submission and payer adjudication
- Payment posting and reconciliation
- Denial management and appeals
- Patient billing and collections
RCM reporting isn’t a single document it’s a system of interconnected reports that, together, tell you exactly where revenue is flowing smoothly and where it’s leaking. Think of it as the financial equivalent of an EKG for your practice: instead of guessing whether the revenue cycle is healthy, you can see the rhythm in real time.
Without this structured reporting, most practices operate reactively. They notice a cash flow problem only after it’s already affected payroll or vendor payments weeks or months after the actual breakdown occurred upstream in the billing process.
2. Why Collections and Cash Flow Break Down Without Reporting
Cash flow problems in healthcare are rarely caused by one dramatic failure. They’re almost always the result of small, compounding inefficiencies that go unnoticed because nobody is measuring them consistently.
Here’s what that looks like in practice:
A claim gets denied for a missing modifier. Nobody catches it for three weeks because there’s no denial report flagging the trend. By the time it’s resubmitted, it’s dangerously close to the payer’s timely filing deadline.
A biller is spending twice as long on one payer’s claims compared to others, but without payer-level performance data, leadership has no way to know that this payer needs a different follow-up cadence or a renegotiated contract.
Patient balances sit untouched for 90+ days because there’s no clear ownership of patient A/R, and no report showing which balances are aging past the point of collectability.
Individually, each of these issues seems minor. Collectively, they’re the reason practices see 15–30% of billed charges never fully collected. RCM reporting is what turns these invisible, scattered problems into visible, prioritized action items.
3. The Hidden Cost of “Reporting Blind Spots”
When a practice doesn’t have structured RCM reporting, three things happen predictably:
A. Revenue Leakage Becomes Normalized
If nobody is tracking clean claim rates or denial trends, a slowly rising denial rate looks like “just how things are” rather than a fixable process failure. Teams stop questioning inefficiencies because they have no baseline to compare against.
B. Cash Flow Becomes Reactive Instead of Predictable
Without historical reporting, practices can’t forecast next month’s collections with any confidence. That makes it harder to plan for payroll, equipment purchases, or staffing decisions everything becomes a guessing game tied to whichever claims happen to get paid that month.
C. Accountability Disappears
When there’s no report showing how long it takes to enter charges, submit claims, or follow up on denials, it becomes almost impossible to identify where the actual bottleneck is is it the front desk, the coding team, the billing team, or the payer? Reporting assigns ownership to each stage of the cycle.
The fix isn’t more effort from your billing team it’s better visibility into where that effort should be focused.
4. The Core RCM Reports Every Practice Should Track
Not all reports carry equal weight. These are the reports that have the most direct, measurable impact on collections and cash flow.
A/R Aging Report
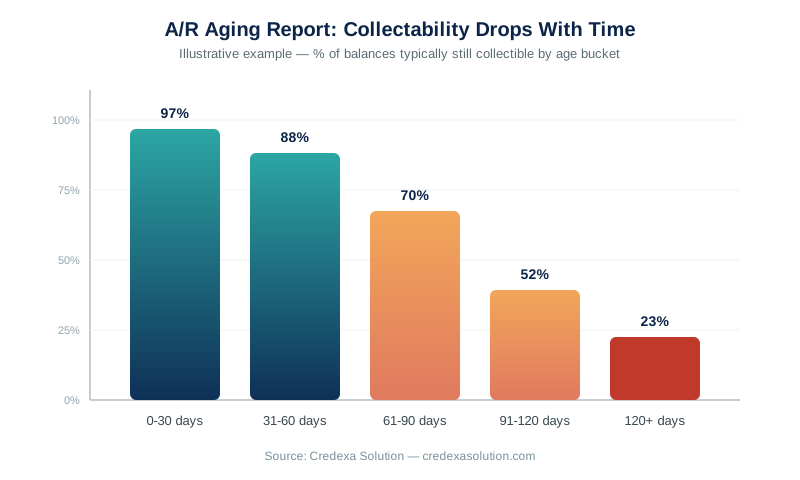
This is the foundation of RCM reporting. It breaks outstanding balances into buckets typically 0–30, 31–60, 61–90, 91–120, and 120+ days so your team can see exactly how old unpaid claims and patient balances are. The rule of thumb: the older a balance gets, the lower its probability of being collected. A/R aging reports let your team triage by dollar value and age instead of working claims in whatever order they land on a desk.
Denial Report
A denial report breaks down why claims are being rejected by denial code, by payer, by provider, and by billing staff member. This is where patterns emerge: maybe a specific CPT code is consistently missing a required modifier, or a specific payer is denying a disproportionate share of claims for medical necessity. Once you can see the pattern, you can fix the root cause instead of re-working the same type of denial over and over.
Clean Claim Rate Report
This measures the percentage of claims accepted by the payer on the very first submission, with no edits or rejections. A high clean claim rate (industry benchmarks typically target 90%+) means faster payments and dramatically less administrative rework. A low clean claim rate is usually a sign of upstream problems incomplete documentation, incorrect coding, or missing prior authorizations.
Days in A/R
This report calculates the average number of days it takes your practice to get paid after a service is rendered. Lower is better. A well-run practice typically keeps Days in A/R under 35–40 days; anything creeping past 50 days is usually a signal of either slow payer processing, staffing bottlenecks, or an ineffective follow-up process.
Collection Rate (Net and Gross)
Gross collection rate measures total collections against total charges. Net collection rate the more meaningful figure measures collections against the amount actually allowed by insurance contracts. A declining net collection rate is one of the clearest early warning signs of a revenue cycle problem, even when the practice “feels” busy.
Charge Lag and Payment Lag Reports
Charge lag tracks the time between a patient visit and when the charge is actually entered into the system. Payment lag tracks the time between claim submission and payment receipt. Delays at either stage directly slow down cash flow, even if every claim eventually gets paid in full.
Payer Performance / Payer Scorecards
This report tracks how each individual payer performs average time to pay, denial rate, and average reimbursement relative to the contracted rate. Payer-specific data lets your team adjust follow-up timing per payer and gives you leverage during contract renegotiations.
Patient Collections Report
Focused specifically on copays, deductibles, and self-pay balances, this report highlights how effectively your front desk and billing team are collecting from patients an increasingly large share of total revenue as high-deductible health plans become more common.
Provider and Staff Productivity Reports
These reports track charge entry timeliness, claim submission speed, and follow-up completion rates by individual staff member or provider. They’re essential for identifying where training or workflow adjustments are needed.
5. Coding Accuracy: The Reporting Layer Most Practices Ignore
One of the most overlooked drivers of clean claim rate and denial rate is coding accuracy and it’s directly measurable through RCM reporting when you segment denials and rejections by CPT and ICD-10 code.
Coding-related denials are rarely random. They cluster around specialties and code sets that carry more complexity bundling rules, modifier requirements, or medical necessity documentation. For example, radiology billing involves a dense set of CPT codes and modifier combinations that are especially prone to first-pass denials if the coding team isn’t current on payer-specific rules. Our detailed breakdown of radiology CPT codes, modifiers, and billing requirements for 2026 walks through exactly where these denials tend to originate and how to code correctly the first time.
The same principle applies on the diagnosis coding side. Conditions with multiple sub-codes like chronic respiratory disease require precise ICD-10 selection to support medical necessity and avoid down coding or denial. Our guide to COPD ICD-10 codes, covering J44.0, J44.1, J44.9, J44.81, and J44.89, is a good example of how granular code selection directly affects whether a claim clears on the first submission or gets kicked back for clarification.
When your denial report shows recurring issues tied to a specific specialty or code family, that’s your signal to go deeper into a coding-specific resource rather than treating every denial as a one-off billing error.
6. Denials, Timely Filing, and the Reports That Catch Them Early
Not every denial is fixable after the fact some become permanently uncollectible the moment a filing deadline passes. This is why your denial reporting needs to be cross-referenced against payer-specific timely filing limits, not just denial reason codes.
Every payer sets its own deadline for original claim submission and corrected claim resubmission, and these deadlines vary significantly sometimes by state, sometimes by plan type. A claim that’s technically “fixable” from a coding standpoint can still be lost permanently if it crosses the payer’s filing window before resubmission. This is one of the most preventable and most common sources of hard revenue loss in any practice.
For example, Blue Cross Blue Shield plans don’t operate on a single national deadline; timely filing limits differ by state affiliate, plan, and claim type (original vs. corrected). Our complete breakdown of the BCBS timely filing limits by plan, state, and claim type for 2026 is built specifically to help billing teams cross-check aging claims against the correct deadline before it’s too late.
A well-built A/R aging report, cross-referenced with a resource like this, should trigger an alert well before a claim approaches its filing cutoff not after. This is exactly the kind of proactive, reporting-driven workflow that separates practices with strong collections from practices that are constantly writing off “timely filing denials” as an unavoidable cost of doing business. It isn’t unavoidable it’s a reporting gap.
7. Turning Reports Into a Repeatable Collections Strategy
Reports alone don’t collect money action does. The value of RCM reporting comes from building a consistent, repeatable process around what the data shows you. Here’s a practical framework:
Step 1: Establish a Reporting Cadence
- Daily: New denials, claim rejections, and charge entry backlogs
- Weekly: A/R aging by bucket, clean claim rate, payer response times
- Monthly: Net collection rate, Days in A/R, payer scorecards, provider productivity
Step 2: Assign Ownership to Each Report
Every report needs an owner responsible for reviewing it and acting on it. A/R aging without an assigned follow-up owner is just a spreadsheet nobody touches.
Step 3: Prioritize by Dollar Value and Age, Not Just Volume
Not every denial or unpaid claim deserves equal attention. Sort by a combination of dollar amount and proximity to the timely filing deadline so your team works the claims with the highest financial impact and the tightest time pressure first.
Step 4: Fix Root Causes, Not Just Symptoms
If your denial report shows the same issue recurring a missing modifier, an incorrect ICD-10 code, an expired authorization that’s a training or workflow fix, not just a resubmission task. Resubmitting the same mistake next month wastes the same amount of staff time again.
Step 5: Review Payer Trends Quarterly
Payer behavior shifts. A payer that used to pay in 14 days may now be taking 35. Quarterly payer scorecard reviews let you catch these shifts before they compound into a larger cash flow problem, and they give you concrete data if you ever need to escalate with a payer representative or renegotiate a contract.
Step 6: Reconcile Forecasts Against Actuals
Use historical RCM data to project expected monthly collections, then compare that forecast against what actually comes in. Consistent variance between the two is a sign that something in your reporting or your revenue cycle needs recalibration.
8. Dashboards, Automation, and the Future of RCM Reporting
Manually pulling reports from a billing system every week is time-consuming and error-prone. In 2026, most well-run practices are moving toward real-time dashboards that pull data directly from the practice management and clearing house systems and update automatically.
A well-designed RCM dashboard typically includes:
- Live A/R aging visualized by payer and provider
- Denial trend charts updated daily
- Clean claim rate tracked against a rolling 30-day average
- Payer performance comparisons side by side
- Automated alerts when a claim approaches a timely filing deadline
The advantage of automated dashboards isn’t just convenience it’s speed of response. A denial trend that would have taken a month to notice in a static spreadsheet report can be flagged within days on a live dashboard, giving your team a much wider window to correct the issue before it repeats across dozens of claims.
Some practices are also beginning to layer predictive analytics on top of standard reporting using historical denial and payment data to flag claims that are statistically more likely to be denied before they’re even submitted. While this level of sophistication isn’t necessary for every practice, it illustrates where RCM reporting is headed: from a rear-view mirror to a forward-looking risk management tool.
9. Benchmarks: What “Good” Actually Looks Like
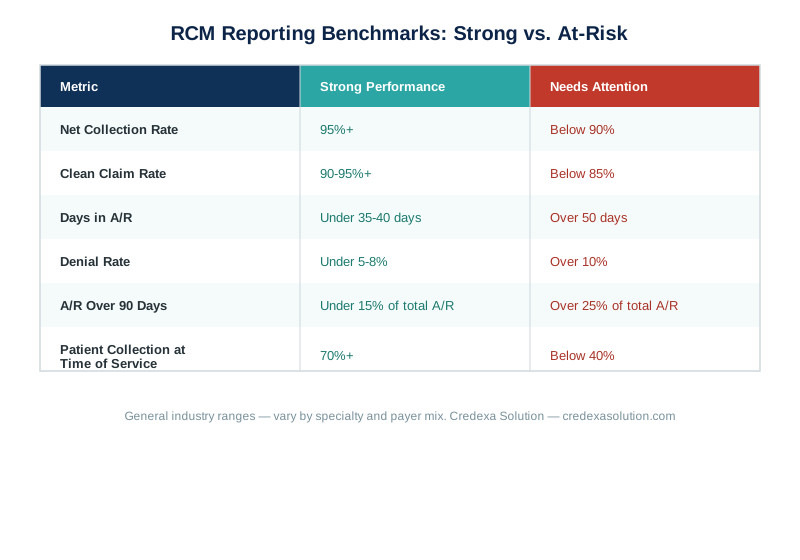
RCM reports are only useful if you know what a healthy number actually looks like. General industry benchmarks to measure your practice against include:
| Metric | Strong Performance | Needs Attention |
|---|---|---|
| Net Collection Rate | 95%+ | Below 90% |
| Clean Claim Rate | 90–95%+ | Below 85% |
| Days in A/R | Under 35–40 days | Over 50 days |
| Denial Rate | Under 5–8% | Over 10% |
| A/R Over 90 Days | Under 15% of total A/R | Over 25% of total A/R |
| Patient Collection Rate at Time of Service | 70%+ | Below 40% |
These figures vary somewhat by specialty and payer mix, but they provide a useful sanity check. If your practice is consistently missing more than one or two of these benchmarks, that’s a strong signal your reporting and the workflows built around it need a structural review, not just a few isolated fixes.
10. Specialty-Specific Reporting: Why One Dashboard Rarely Fits Every Practice
A generic RCM report template will tell you that something is wrong, but specialty-specific reporting tells you what and why. Different specialties carry different denial risks, different documentation requirements, and different coding complexity which means your reporting should be tuned accordingly.
Diagnostic and imaging-heavy specialties, for example, tend to see a disproportionate share of denials tied to modifier usage, bundling edits, and medical necessity documentation. If your denial report shows recurring issues in this category, it’s worth reviewing the underlying code set directly our complete radiology CPT codes and modifiers guide for 2026 breaks down exactly which combinations tend to trigger rejections and how to bill them correctly the first time.
Chronic disease management specialties, such as pulmonology and primary care practices treating patients with respiratory conditions, face a different challenge: selecting the correct level of ICD-10 specificity to support medical necessity. A claim coded with an unspecified diagnosis when a more specific code applies can trigger downcoding or an outright denial. Our COPD ICD-10 codes guide walks through how to apply J44.0, J44.1, J44.9, J44.81, and J44.89 correctly, which is directly reflected in cleaner claims and fewer resubmissions.
The broader lesson: when your RCM reporting flags a recurring problem, the fix usually isn’t “resubmit and hope.” It’s tracing that denial pattern back to a specific code family or payer policy and correcting the underlying workflow a process that becomes far more efficient when your reporting is segmented by specialty from the start rather than lumped into a single practice-wide number.
11. Common RCM Reporting Mistakes That Quietly Drain Revenue
Even practices that do run reports often undermine their own value in a few predictable ways:
Looking at reports without context. A denial rate of 8% means nothing on its own it matters relative to last month, relative to your specialty’s benchmark, and relative to payer mix.
Treating reports as a monthly formality instead of a decision-making tool. If nobody changes a process based on what the report shows, the report has no operational value it’s just documentation.
Not segmenting data by payer, provider, or code. Aggregate numbers hide the specific problem. A practice-wide clean claim rate of 88% might be masking one payer or one provider dragging the average down significantly.
Ignoring patient A/R because insurance A/R feels more urgent. With patient financial responsibility rising across nearly every plan type, patient balances left unmanaged can represent a meaningful share of total uncollected revenue.
No feedback loop back to coding and front-desk staff. Reports that stay within the billing department never reach the people who could actually prevent the errors coders, schedulers, and front-desk staff at the source.
Fixing these habits doesn’t require new software; it requires a disciplined process for reviewing reports and closing the loop with the right team members every time a pattern emerges.
12. How Credexa Solution Builds Reporting Into Your Revenue Cycle
At Credexa Solution, we don’t treat reporting as an add-on to billing we treat it as the operating system your entire revenue cycle runs on. That means:
- Custom RCM dashboards built around your specialty, payer mix, and existing practice management system, so you can see A/R, denials, and collections in real time instead of waiting for a month-end summary.
- Coding-aware denial analysis, where every denial is traced back to its root cause whether that’s a CPT or ICD-10 coding issue, a missing authorization, or a payer-specific policy using the same level of detail found in our specialty coding guides.
- Timely filing safeguards, cross-referencing every aging claim against the correct payer-specific deadline so nothing is lost simply because a filing window closed unnoticed.
- Monthly and weekly reporting packages covering net collection rate, Days in A/R, denial trends, and payer performance, with clear, plain-language recommendations rather than raw exported spreadsheets.
- Ongoing benchmarking against specialty-specific industry standards, so you always know whether your numbers reflect a healthy revenue cycle or a developing problem.
Our goal is simple: give your team the visibility to act early, instead of discovering revenue problems months after they’ve already affected payroll or growth plans. If you’d like a closer look at how your practice’s reporting compares to industry benchmarks, reach out to the Credexa Solution team for a revenue cycle review.
13. Conclusion
Strong collections and predictable cash flow are never accidental they’re the direct result of a practice that can see its own revenue cycle clearly and act on what it sees. RCM reporting is what makes that visibility possible: it turns vague frustration (“collections feel slow this quarter”) into a specific, fixable problem (“Payer X’s denial rate jumped 6% due to a missing authorization step”).
The practices that consistently outperform their peers on collections aren’t necessarily working harder they’re working from better information. A/R aging, denial trends, clean claim rate, Days in A/R, and payer scorecards aren’t just administrative paperwork; they’re the earliest warning system your practice has for protecting revenue before it’s lost.
If your current reporting can’t answer basic questions like “which payer is slowing us down the most” or “how close are we to losing this claim to a filing deadline,” it’s time to rebuild that visibility from the ground up. Credexa Solution helps practices do exactly that turning scattered billing data into a clear, actionable reporting system that protects collections and stabilizes cash flow month after month.
14. Frequently Asked Questions
Q1: What is RCM reporting in medical billing? RCM reporting is the ongoing tracking and analysis of every stage of the revenue cycle scheduling, charge capture, claim submission, payment posting, denials, and patient collections to identify where revenue is delayed, denied, or lost.
Q2: How does RCM reporting improve collections? It surfaces specific, actionable problems aging claims, recurring denial reasons, slow-paying payers — so billing teams can prioritize follow-up by dollar value and urgency instead of working claims randomly.
Q3: What is the most important RCM report to start with? The A/R aging report is typically the best starting point, since it immediately shows how much revenue is at risk and how close claims are to becoming uncollectible.
Q4: How often should a practice review its RCM reports? Denials and charge entry should be reviewed daily or weekly; A/R aging and clean claim rate weekly; and net collection rate, Days in A/R, and payer performance on a monthly basis.
Q5: Can RCM reporting help reduce claim denials? Yes. Denial reports segmented by code, payer, and provider reveal recurring patterns such as coding errors or missing authorizations that can be corrected at the source to prevent future denials.
Q6: How does coding accuracy connect to RCM reporting? Coding errors are one of the most common root causes behind low clean claim rates and repeat denials. Reviewing denial reports by CPT and ICD-10 code helps identify exactly where coding needs correction, as shown in resources like our radiology CPT codes guide and COPD ICD-10 codes guide.
Q7: What role does timely filing play in cash flow? Every payer has a specific deadline for original and corrected claim submissions. Missing that window makes a claim permanently uncollectible, regardless of whether the underlying issue was fixable. Our BCBS timely filing limits guide is a good example of how these deadlines vary by plan and state.
Q8: What’s a healthy Days in A/R benchmark? Most well-managed practices keep Days in A/R under 35–40 days. Anything consistently above 50 days usually signals a bottleneck in claim submission, payer processing, or follow-up.
Q9: Do small or solo practices need RCM reporting? Yes. Practice size doesn’t reduce the need for visibility if anything, smaller practices are more vulnerable to cash flow disruption from a handful of unpaid or denied claims, making reporting even more critical.
Q10: How can Credexa Solution help improve my practice’s reporting? Credexa Solution builds custom RCM dashboards, tracks denials down to the coding and payer level, cross-checks claims against payer-specific timely filing deadlines, and delivers ongoing reporting packages with clear recommendations. Contact Credexa Solution to review your current revenue cycle reporting.