By the Revenue Cycle Team at CredexaSolutions
Most medical practices don’t have a collections problem. They have a visibility problem.
Money is moving through the revenue cycle every single day — claims going out, payers responding, patients getting billed — but almost none of it is being measured in a way that tells anyone what’s actually happening. A denial gets reworked without anyone asking why it happened in the first place. A claim sits in accounts receivable for 95 days without a single follow-up call. A payer quietly starts underpaying on a specific CPT code, and nobody notices for two full quarters.
This is the gap that RCM reporting exists to close. Revenue cycle management reporting turns the thousands of individual transactions moving through your billing system — charges, claims, denials, payments, adjustments, patient balances — into a small number of numbers that tell you, at a glance, whether your revenue cycle is healthy or quietly bleeding.
At CredexaSolutions, we work with practices that range from a single-provider office to multi-location specialty groups, and the pattern is remarkably consistent: the practices with the strongest cash flow are rarely the ones with the fewest denials or the cleanest coding. They’re the ones that review their reports on a fixed schedule and act on what those reports say. Reporting isn’t a compliance exercise sitting in a folder — it’s the operating system for your entire collections strategy.
This guide walks through why RCM reporting matters, which specific reports move the needle on collections and cash flow, how to read them without getting lost in the numbers, and how to build a reporting habit your team will actually keep.
Table of Contents
- Why RCM Reporting Is the Foundation of Financial Health
- The Six Ways Reporting Directly Improves Collections
- The Reports Every Practice Should Be Reviewing
- How to Read an A/R Aging Report Without Getting Overwhelmed
- Turning Denial Data Into Fewer Future Denials
- Payer Scorecards: Why Not All Insurance Companies Behave the Same
- Where Enrollment and Credentialing Quietly Wreck Your Reports
- Building a Reporting Cadence That Actually Sticks
- Common Reporting Mistakes That Cost Practices Money
- How CredexaSolutions Builds Reporting Into Your Revenue Cycle
- Frequently Asked Questions
1. Why RCM Reporting Is the Foundation of Financial Health
Every dollar your practice earns passes through a sequence of steps: a patient is scheduled, insurance is verified, a service is rendered, a charge is entered, a claim is submitted, a payer responds, and a payment (hopefully) lands. Revenue cycle management reporting simply measures each one of those steps and tells you where the friction is.
Without reporting, a practice is flying on instinct. A biller “feels like” denials are up this month. A practice manager “thinks” a particular payer is slow. An owner notices that deposits look thinner than usual but has no way to say why. None of those impressions can be acted on, because none of them are measurable.
With structured reporting, the same practice can say something very different: Denials from Payer X increased 14% in the last 60 days, driven almost entirely by missing prior authorizations on physical therapy codes. That’s a sentence you can act on. You can retrain front-desk staff, fix the authorization workflow, and watch the number come back down next month. That shift — from a feeling to a fact — is the entire value of RCM reporting.
Cash flow, in particular, depends on this kind of specificity. A practice can be seeing more patients than ever and still be short on cash if claims are aging past 90 days, if the clean claim rate has quietly dropped, or if patient balances are going uncollected at the front desk. Reporting is what surfaces these problems while they’re still small and fixable, rather than after they’ve become a six-figure write-off conversation with your accountant.
2. The Six Ways Reporting Directly Improves Collections
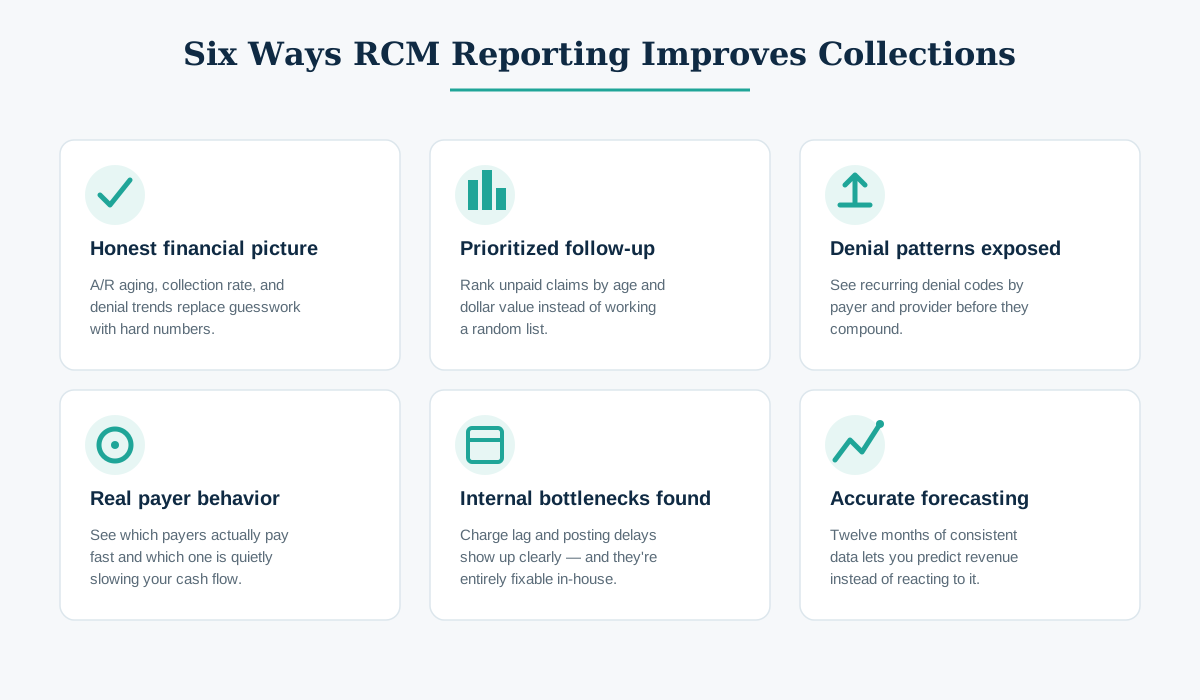
Reporting doesn’t collect money by itself — but it directs every dollar of collection effort toward where it will actually pay off. Here’s how that plays out in practice.
It gives you an honest picture of financial health
A/R aging, collection rate, and denial trend reports strip away the guesswork. Instead of a general sense that “collections feel slow this quarter,” you can see exactly which service lines, providers, or payers are dragging on the average. This is the difference between managing your revenue cycle and simply hoping it works out.
It tells your team where to spend their time
Not every unpaid claim deserves equal attention. A $40 balance sitting at day 20 and a $4,000 balance sitting at day 85 and about to hit a timely-filing deadline are not the same problem, but without a report ranking claims by dollar value and age, a biller has no reliable way to know which one to work first. Reporting turns follow-up from a random list into a prioritized queue.
It exposes denial patterns before they compound
A single denial is a nuisance. The same denial code appearing across 30 claims from the same payer is a systemic problem — and it’s invisible unless someone is looking at denial data in aggregate rather than one claim at a time.
It shows you which payers are actually easy to work with
Some payers pay in 12 days with a 98% clean claim rate. Others sit on claims for 45 days and deny a quarter of first submissions. Without payer-level reporting, every insurance company looks the same on paper — and you lose the ability to negotiate contracts, staff follow-up, or make network decisions based on real payer behavior.
It reveals bottlenecks inside your own team
Charge lag and payment posting reports don’t just measure the payer side of the relationship — they measure yours. If charges sit for five days before entry, or if payments sit unposted for a week, that delay shows up directly in your cash flow, and it has nothing to do with insurance companies at all.
It makes forecasting possible
Once you have 12 months of consistent reporting, you can start predicting revenue instead of reacting to it. Seasonal dips, the effect of adding a new provider, the cash impact of a slow-paying new payer contract — all of this becomes visible months in advance instead of showing up as a surprise on a bank statement.
3. The Reports Every Practice Should Be Reviewing
Different reports answer different questions. Here are the ones that matter most for collections and cash flow specifically.
A/R Aging Report
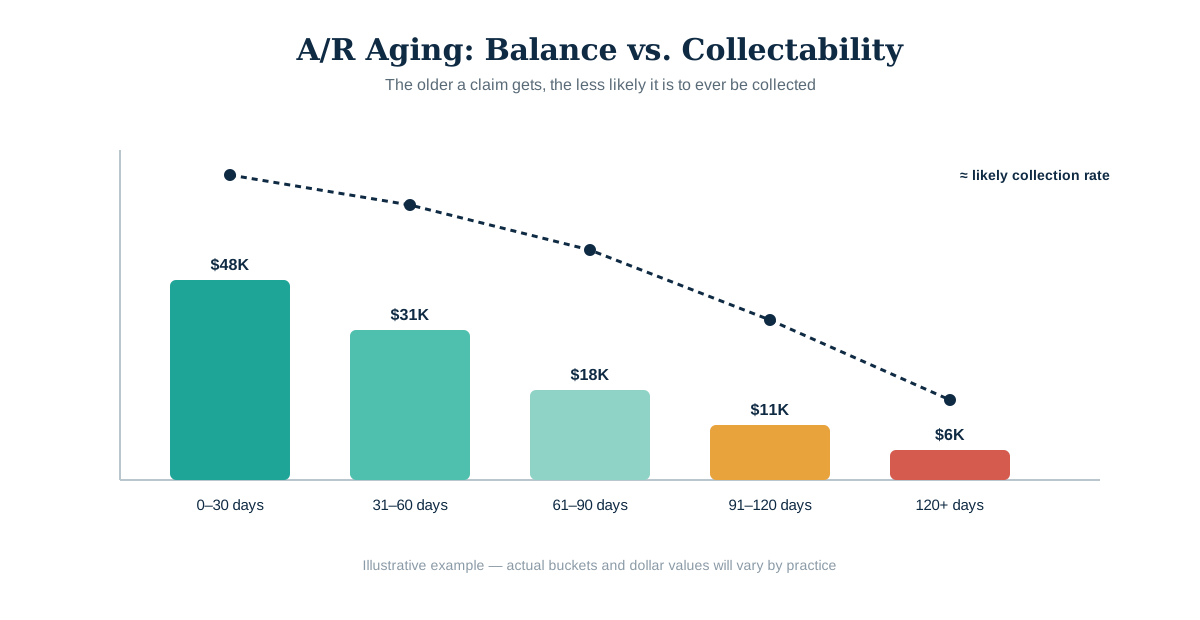
This is the single most important report in the revenue cycle. It breaks outstanding balances into buckets — typically 0–30, 31–60, 61–90, 91–120, and 120+ days — so you can see, at a glance, how much money is sitting where in the collection timeline.
The rule to remember: the older the balance, the lower the odds of ever collecting it. Industry data consistently shows that claims older than 90 days collect at a fraction of the rate of claims under 30 days. A healthy A/R aging report should show the majority of your outstanding balance concentrated in the 0–30 and 31–60 buckets, with very little sitting past 90 days.
Denial Report
A denial report breaks down every rejected or denied claim by reason code, payer, provider, and service line. The goal isn’t just to see how many claims were denied — it’s to see why, so you can fix the upstream cause rather than reworking the same mistake every month.
Net Collection Rate
Net collection rate measures how much of what you were actually entitled to collect (after contractual adjustments) you actually collected. This is a more honest number than gross collection rate, because it accounts for the fact that you were never going to collect the full billed charge from an insurance-contracted patient in the first place. A net collection rate below roughly 95% is usually a sign of underpayments, missed appeals, or write-offs that shouldn’t have happened.
Clean Claim Rate
This measures the percentage of claims accepted by a payer on the very first submission, with no edits or corrections required. A high clean claim rate means faster payment and less staff time spent reworking claims. A low one is often traceable to a small number of recurring data-entry or eligibility errors — which is exactly the kind of thing a report can catch that a person scanning claims one at a time will miss.
Days in A/R
This measures, on average, how many days it takes your practice to get paid after a service is rendered. It’s calculated by dividing total A/R by your average daily charges. Lower is better — most well-run practices aim to keep this number under 40 days, and cash flow tightens noticeably once it starts creeping past 50 or 60.
Charge Lag and Payment Posting Lag
Charge lag measures the time between when a service happens and when the charge is actually entered into the billing system. Payment posting lag measures the time between when a payment is received and when it’s posted to the patient’s account. Both delays are entirely internal, entirely fixable, and both directly slow down your reported cash position even when nothing is wrong with your payers at all.
Patient Collection Performance
With deductibles and copays making up a growing share of practice revenue, tracking how well your front desk collects at time of service — and how well your billing team collects on patient balances afterward — has become just as important as tracking payer performance. A weak patient collection report usually points to a front-desk training gap rather than a billing problem.
Payer Performance / Payer Scorecard
This report ranks each payer by average days to pay, denial rate, and clean claim rate, giving you a side-by-side comparison of how each insurance company actually behaves — information that’s useful both for staffing follow-up work and for contract renegotiation conversations.
4. How to Read an A/R Aging Report Without Getting Overwhelmed
A/R aging reports intimidate a lot of practice managers simply because of the volume of line items. The fix is to stop reading it top to bottom and start reading it by priority.
Start with the 91+ day bucket. This is money at the highest risk of never being collected. Every claim here needs a status check this week — not eventually, this week — because timely filing deadlines are often already close or already passed.
Then sort by dollar value, not by age, within each bucket. A $50 claim sitting at day 45 is not worth the same phone call as a $2,500 claim sitting at day 40. Time is your scarcest resource in a billing department, and reports let you spend it on the balances that actually move the needle.
Watch the trend, not just the snapshot. A single month’s aging report tells you where things stand today. Three consecutive months of the same report, compared side by side, tells you whether your process is improving or quietly deteriorating — which is the more important question.
Segment by payer. If 80% of your 90+ day balance sits with two payers, that’s not a general collections problem — it’s a specific relationship that needs a phone call to a provider representative, and possibly a contract-level conversation.
5. Turning Denial Data Into Fewer Future Denials
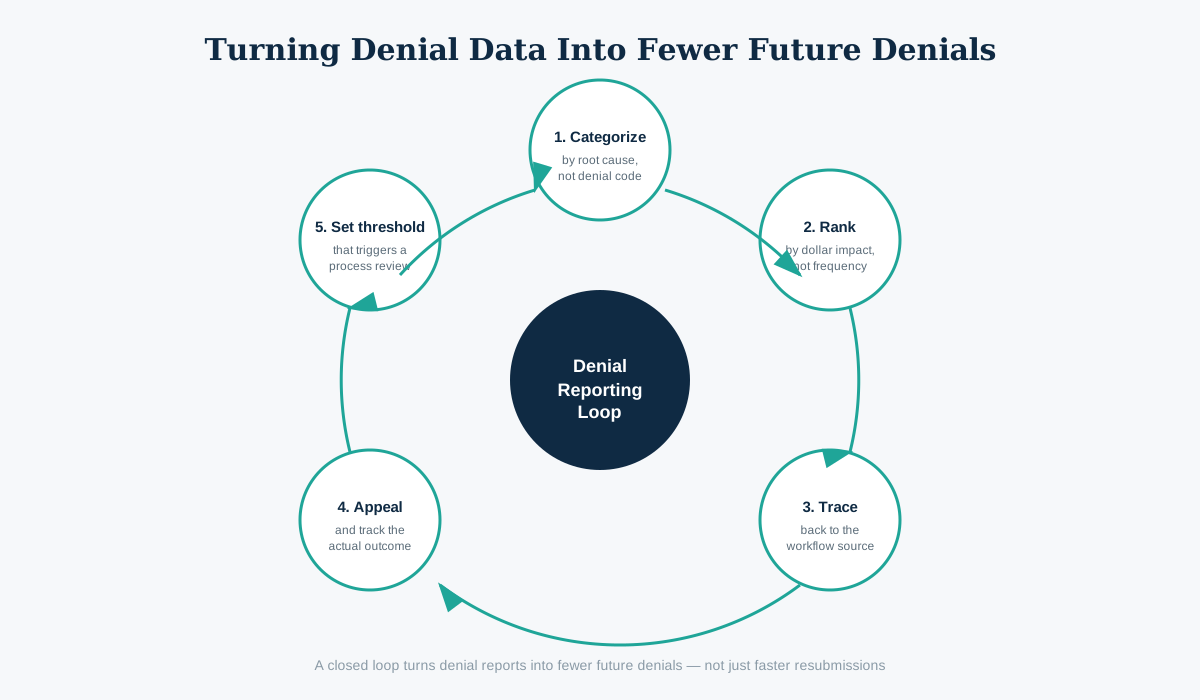
Denial reports are only useful if someone closes the loop between the data and the process that caused it. The steps that actually move the needle look like this:
Categorize before you count. Group denials into a handful of root-cause buckets — eligibility, authorization, coding, timely filing, missing information, medical necessity — rather than tracking dozens of individual denial codes separately. Patterns are far easier to spot at the category level.
Rank by dollar impact, not by frequency. A denial reason that happens rarely but attaches to high-dollar claims can matter more to your bottom line than one that happens constantly on small balances.
Trace the highest-impact category back to its source. If “missing authorization” is your top denial reason, the fix isn’t better appeals — it’s a front-end workflow change so authorizations get verified before the appointment, not after the claim bounces.
Track the appeal outcome, not just the appeal submission. A denial report that only shows how many appeals were filed is incomplete. You need to know how many of those appeals were actually overturned, because that tells you whether your appeal arguments are working or whether you’re spending staff time on a fight you’re statistically unlikely to win.
Set a threshold that triggers action. Decide in advance what denial rate, by payer or by code, requires an immediate process review rather than waiting for it to show up as a trend three months later.
6. Payer Scorecards: Why Not All Insurance Companies Behave the Same
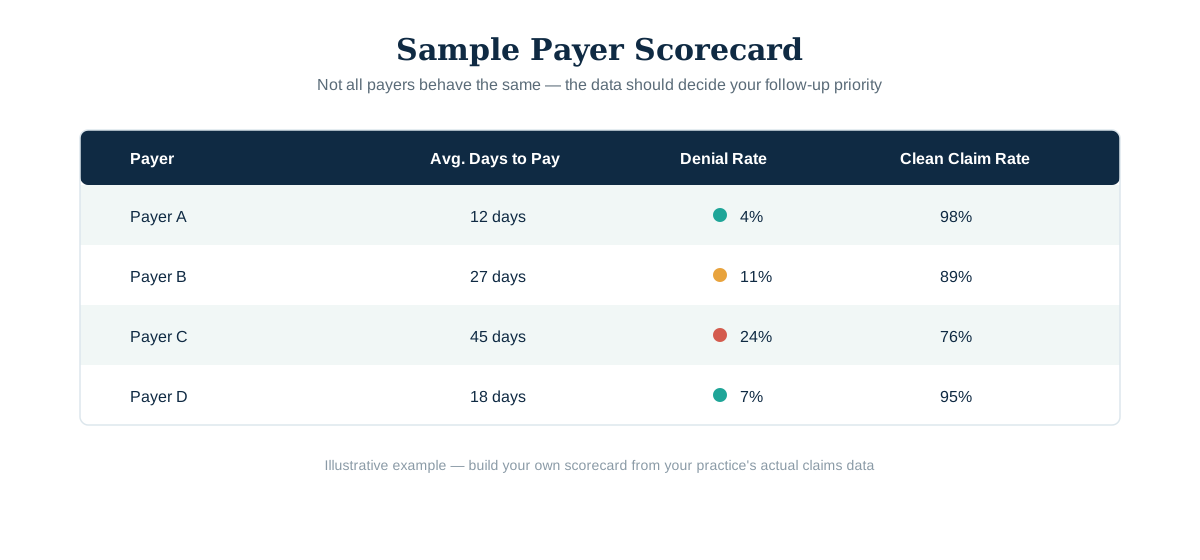
One of the most underused reports in medical billing is the payer scorecard — a side-by-side comparison of how each contracted insurance company actually performs on the metrics that matter to your cash flow: average days to pay, denial rate, clean claim rate, and appeal success rate.
The value here is that payer behavior varies enormously, and without a report making that visible, every payer gets treated the same by your staff — which means your slowest, highest-denial payers get the same amount of follow-up attention as your fastest, most reliable ones.
A payer scorecard lets you do three things you genuinely cannot do without it: staff your follow-up work proportionally to how much attention each payer actually needs, walk into contract renegotiation conversations with real performance data instead of a general impression, and flag a payer relationship that’s deteriorating before it becomes a serious cash flow problem.
7. Where Enrollment and Credentialing Quietly Wreck Your Reports
Here’s a connection that gets missed constantly: a large share of the denials and aging balances that show up in RCM reports don’t originate in billing at all — they originate months earlier, at the credentialing and enrollment stage.
A claim submitted before a provider’s effective date with a payer is not billable as in-network, no matter how clean the coding is. A gap in re-credentialing silently flips a provider to out-of-network status, and every claim submitted after that date starts denying — often without anyone connecting the denial pattern back to an expired credentialing file until the A/R aging report shows a payer-specific spike that nobody can immediately explain.
This is exactly the kind of blind spot a denial report is built to catch — a sudden cluster of denials tied to one payer and one provider, with a reason code pointing to network status rather than a coding error. If you’re seeing that pattern, the fix isn’t in your billing workflow at all; it’s in your enrollment file.
We’ve written in detail about exactly this process for one of the larger national payers — including the specific deadlines that quietly lapse and cause this kind of denial spike — in our guide to Wellpoint provider enrollment. If your denial reports are showing an unexplained cluster of “not credentialed” or “coverage terminated” denials tied to a specific payer, that’s worth a read before you assume the problem is on the billing side.
8. Building a Reporting Cadence That Actually Sticks
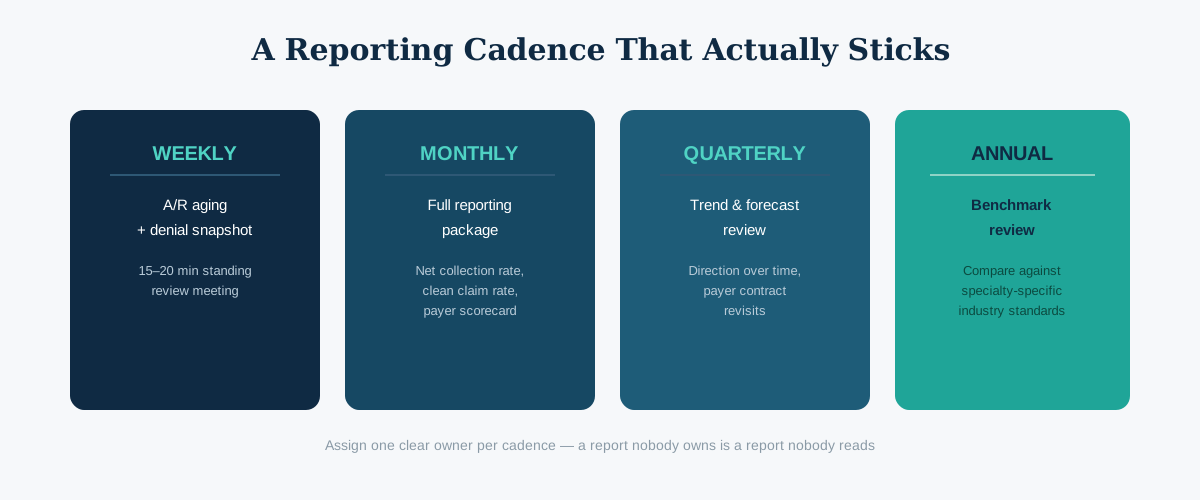
The single biggest reason RCM reporting fails to improve collections isn’t bad reports — it’s inconsistent review. A dashboard nobody opens is worth exactly nothing.
Weekly: A/R aging and denial snapshot. A short, standing 15–20 minute meeting to review new denials and any claim that crossed into the 61+ day bucket. This is where problems get caught in week three instead of month three.
Monthly: full reporting package. Net collection rate, clean claim rate, days in A/R, charge lag, and payer scorecard reviewed together, compared against the prior month and against the same month last year if you have the history.
Quarterly: trend and forecast review. Step back from individual claims and look at direction — is days in A/R trending down over two quarters, or is a slow drift upward being masked by month-to-month noise? This is also the right cadence to revisit payer contracts based on scorecard data.
Annually: benchmark against industry standards. Compare your practice’s numbers against specialty-specific benchmarks to see whether what feels normal internally is actually normal, or whether you’ve simply gotten used to a slow-paying process.
Assign clear ownership to each cadence. A report that “everyone” is supposed to check is a report no one actually checks — someone specific needs to own the weekly review, someone specific needs to own the monthly package, and that person needs the authority to act on what they find.
9. Common Reporting Mistakes That Cost Practices Money
Looking at gross numbers instead of trends. A single month’s collection rate tells you far less than three consecutive months moving in the same direction.
Treating all A/R the same age. A flat “total outstanding balance” number hides the difference between money that’s still collectible and money that’s effectively already lost.
Reviewing reports without a designated owner. If a report doesn’t have someone whose job it is to read it and act on it, it will quietly stop being generated, or it will be generated and ignored.
Ignoring small, recurring denial reasons. A denial reason that costs $30 per occurrence but happens 200 times a month is a $6,000-a-month problem hiding in plain sight because no single instance of it looks urgent.
Not separating patient responsibility from payer responsibility. Blending these together in reporting makes it impossible to tell whether your collections problem is on the insurance side or the patient side — and the fix for each is completely different.
Setting up dashboards and never revisiting them. Reporting needs match your practice’s needs, which change. A dashboard built two years ago for a two-provider practice may be missing entire categories relevant to the five-provider group you are today.
10. How CredexaSolutions Builds Reporting Into Your Revenue Cycle
At CredexaSolutions, reporting isn’t an add-on service we offer — it’s the backbone of how we manage every revenue cycle engagement. We believe a practice should never have to ask “where is our money?” without an immediate, data-backed answer.
Here’s what that looks like in practice:
- Custom reporting dashboards built around your specific specialty, payer mix, and provider count — not a generic template.
- A structured weekly and monthly reporting cadence, so A/R aging, denial trends, and payer performance are reviewed on a schedule, not only when something already feels wrong.
- Root-cause denial analysis, tracing recurring denial patterns back to their actual source — whether that’s coding, authorization, eligibility, or an enrollment gap — rather than simply resubmitting the same claim.
- Payer-specific performance tracking, so your team knows exactly which payers need proactive follow-up and which ones can be trusted to pay on schedule.
- Credentialing and enrollment oversight, so the denials that originate from an expired CAQH attestation or a missed recredentialing deadline get caught before they show up as a mystery spike in your A/R report.
- Plain-language monthly summaries, translating the numbers into specific, actionable recommendations rather than handing you a spreadsheet and leaving you to interpret it alone.
If your practice is looking at its numbers each month and still can’t answer basic questions — why collections dipped, which payer is slowest, why a specific service line keeps getting denied — that’s the reporting gap we specialize in closing. Reach out to CredexaSolutions for a free revenue cycle assessment and we’ll show you exactly what your current reporting is and isn’t telling you.
11. Frequently Asked Questions
What is RCM reporting? RCM reporting is the practice of tracking and analyzing data from every stage of the revenue cycle — scheduling, charge capture, claim submission, payer response, payment posting, and patient collections — to understand how well a practice is converting rendered services into collected revenue.
How does RCM reporting improve collections? It identifies exactly where money is stuck — aging claims, recurring denials, slow payers, uncollected patient balances — so staff time and follow-up effort can be directed at the balances most likely to be collected, instead of spread evenly across everything.
Which RCM reports matter most for cash flow? A/R aging, denial reports, net collection rate, clean claim rate, days in A/R, and payer scorecards are the core set. Charge lag and patient collection performance reports round out a complete picture.
How often should a practice review its RCM reports? A/R aging and denial trends should be checked weekly at minimum. A full reporting package — including net collection rate and payer performance — should be reviewed monthly, with a broader trend and contract review conducted quarterly.
What’s a healthy days-in-A/R number? Most well-managed practices keep days in A/R under 40. Numbers consistently above 50–60 usually indicate either slow-paying payers, internal charge-entry delays, or a follow-up process that isn’t catching aging claims early enough.
Can RCM reporting reduce denials? Yes. Denial reports reveal recurring patterns — a specific payer, code, or process step responsible for a disproportionate share of denials — which lets a practice fix the root cause rather than reworking the same type of denial indefinitely.
Why do some claims deny even when the coding is correct? A significant share of “clean” claims still deny for reasons that have nothing to do with coding — expired credentialing, a lapsed CAQH attestation, or a provider enrollment gap with a specific payer. These show up in denial reports as network-status or eligibility denials rather than coding errors.
Do small practices need formal RCM reporting? Yes. A solo provider has a smaller volume of claims, but each one represents a larger share of total revenue, which makes tracking A/R aging and denial patterns arguably more important, not less.
What happens if a practice ignores its aging report? The longer a claim sits unpaid, the lower its odds of ever being collected, and many payers enforce hard timely-filing deadlines. Ignoring an aging report typically results in a growing balance of claims that are functionally already unrecoverable.
How does CredexaSolutions support RCM reporting? CredexaSolutions builds custom reporting dashboards, runs a structured weekly and monthly review cadence, performs root-cause denial analysis, tracks payer-specific performance, and monitors credentialing and enrollment deadlines that commonly cause unexplained denial spikes — combining all of it into plain-language recommendations your team can act on immediately.
Struggling to get a clear answer on where your revenue cycle stands? CredexaSolutions builds custom RCM reporting and manages the full billing and credentialing cycle so your collections and cash flow stop depending on guesswork. Contact our team for a free consultation.