
If you run a medical practice, you already know the feeling: claims go out, some money comes back, and somewhere in between a chunk of your revenue just… disappears. No dramatic event causes it. It leaks out slowly, through small inefficiencies that are easy to miss unless you’re measuring them.
That’s exactly what KPIs (Key Performance Indicators) are for. In medical billing, KPIs are the vital signs of your revenue cycle the numbers that tell you whether claims are getting paid, how fast, and how much is being left on the table. Practices that track these metrics consistently catch problems in weeks instead of quarters. Practices that don’t usually find out about a broken process only after it’s cost them tens of thousands of dollars.
In this guide, we’ll walk through the 15 revenue cycle metrics that matter most in 2026, what “good” looks like for each one, and what to do when your numbers fall short. If you’re also untangling how coding accuracy affects these numbers, our <a href=”https://credexasolution.com/2026/09/11/cpt-codes-in-medical-billing-the-complete-2026-guide-for-healthcare-providers/”>complete guide to CPT codes in medical billing</a> is a useful companion piece, since coding errors are one of the biggest hidden drivers behind several of the KPIs below.
Why Medical Billing KPIs Matter More Than Ever in 2026
Reimbursement pressure hasn’t eased up. Payers continue tightening documentation requirements, denial rates keep climbing across specialties, and staffing shortages mean billing teams are doing more with less. In that environment, “we think collections are okay” isn’t a strategy it’s a guess.
KPIs replace guessing with evidence. They let a practice administrator or physician-owner answer three questions with confidence:
- Is money coming in as fast as it should?
- Where exactly is revenue getting stuck or lost?
- Is the billing process improving or quietly getting worse?
Organizations like the Healthcare Financial Management Association (HFMA) and the Medical Group Management Association (MGMA) publish standardized benchmarks precisely so that practices have something real to measure themselves against, rather than comparing this year to last year in isolation. We’ll reference several of those industry benchmarks throughout this article so you know not just what to measure, but what a healthy number actually looks like.
Let’s get into the 15 metrics.
1. Clean Claim Rate (CCR)
What it measures: The percentage of claims that are accepted by the payer on the first submission, with no errors, rejections, or requests for additional information.
Why it matters: This is often considered the single best early-warning indicator of billing quality. A clean claim moves straight through the payer’s system and gets paid on schedule. A “dirty” claim one with a missing modifier, a mismatched patient ID, or an invalid diagnosis-procedure pairing gets kicked back, and every kickback adds days or weeks to your payment timeline.
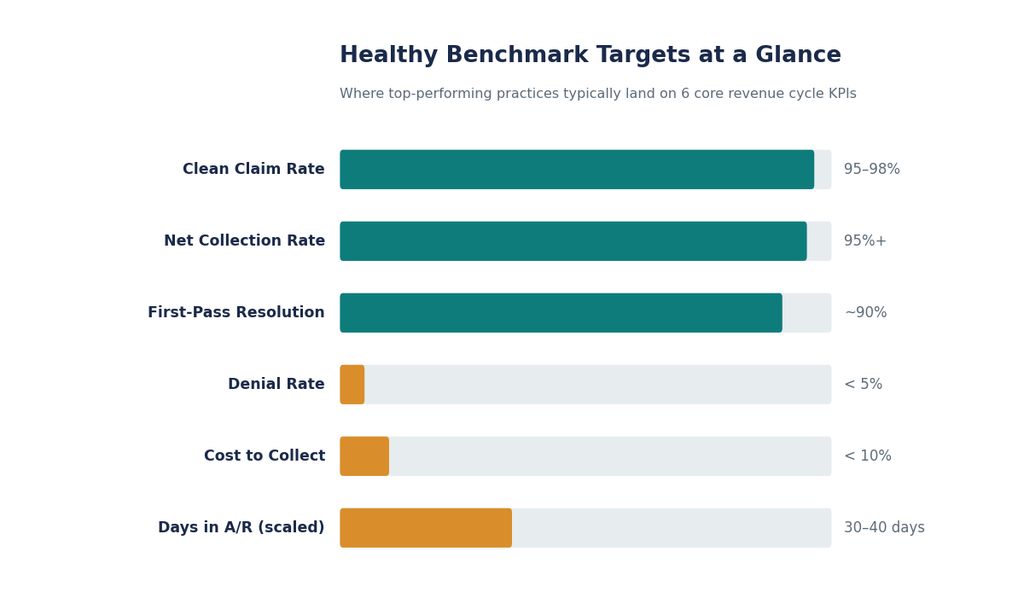
Benchmark: A healthy clean claim rate sits in the 95–98% range. Anything meaningfully below that suggests problems at the front end of your workflow: eligibility checks, coding, or claim scrubbing.
How to improve it: Invest in claim-scrubbing software that flags errors before submission, standardize your intake and eligibility-verification process, and audit coding accuracy regularly. A large share of clean-claim failures trace back to coding issues, which is why getting CPT and diagnosis coding right at the source matters so much something we cover in depth in our guide to CPT coding.
2. Denial Rate
What it measures: The percentage of submitted claims that are denied by the payer, rather than paid.
Why it matters: Every denied claim represents delayed or sometimes permanently lost revenue, plus the added labor cost of reworking and resubmitting it. Denial rates have been trending upward industry-wide, with some analyses putting average denial rates at or above 12% for hospitals and practices alike.
Benchmark: Best-in-class practices keep denial rates under 5%. Anything above 10% should be treated as an urgent operational issue, not a routine cost of doing business.
How to improve it: Track denials by reason code, not just by volume “why” matters more than “how many.” Most denials cluster around a handful of root causes: eligibility issues, missing prior authorizations, coding mismatches, and timely-filing errors. For a deep, step-by-step framework on preventing, tracking, and overturning denials, see our full <a href=”https://credexasolution.com/2026/09/11/denial-management-process-in-medical-billing-a-complete-2026-guide-to-preventing-tracking-and-overturning-claim-denials/”>denial management process guide</a>.
3. First-Pass Resolution Rate (FPRR)
What it measures: The percentage of claims that are paid in full after just one submission, without any resubmission, appeal, or correction.
Why it matters: FPRR is closely related to clean claim rate but focuses specifically on final resolution, not just initial acceptance. A high FPRR means less rework for your billing team and faster, more predictable cash flow. It’s also a number payers notice — practices with consistently strong first-pass performance often have more leverage in contract negotiations.
Benchmark: Leading practices achieve first-pass resolution rates approaching 90% or higher.
How to improve it: This metric improves when clean claim rate and front-end data accuracy improve. Automating eligibility verification, reducing manual data entry, and closing the feedback loop between denial reasons and coding training all lift FPRR over time.
4. Days in Accounts Receivable (Days in A/R)
What it measures: The average number of days it takes your practice to collect payment after a service has been rendered.
Why it matters: This is the clearest single measure of cash flow efficiency. The longer money sits in A/R, the more it costs you not just in delayed cash, but in the increasing difficulty of ever collecting it, since claims and patient balances become harder to recover the older they get.
Benchmark: Industry targets generally fall in the 30–40 day range, with best performers closer to 30 days or under. Once Days in A/R climbs past 50, it’s usually a sign of upstream breakdowns slow payer follow-up, incomplete registration data, or a growing backlog of unworked denials.
How to improve it: Segment your A/R by payer and by aging bucket (0–30, 31–60, 61–90, 90+ days) so your team can prioritize the claims most at risk of becoming uncollectible, rather than working oldest-first by default.
5. Net Collection Rate (NCR)
What it measures: The percentage of revenue actually collected out of the total amount that was legitimately allowed and collectible, after contractual adjustments and write-offs.
Why it matters: Net collection rate is arguably the most honest measure of revenue cycle health because it strips out the “noise” of gross charges (which are often inflated relative to actual allowed amounts) and shows what you’re really keeping.
Benchmark: A strong net collection rate is typically 95% or higher. A declining NCR over several months is one of the earliest signs that something in the revenue cycle coding, denials, or patient collections is quietly deteriorating.
How to improve it: Reconcile NCR monthly, not annually, and break it down by payer. A dropping NCR with one specific payer often points to a contract or credentialing issue rather than an internal process failure.
6. Gross Collection Rate (GCR)
What it measures: Total payments collected divided by total charges billed, before contractual adjustments are applied.
Why it matters: GCR is a much blunter instrument than net collection rate, since it’s heavily influenced by your fee schedule relative to payer contracts. Still, tracking it over time rather than as a single-point comparison across practices can highlight shifts in payer mix or pricing that deserve a closer look.
Benchmark: Because GCR varies so much by specialty and fee-schedule design, it’s most useful as a trend line for your own practice rather than compared against outside benchmarks.
How to improve it: Use GCR alongside NCR, not instead of it. If GCR is falling but NCR is stable, the issue is usually pricing or payer mix, not collections performance.
7. Cost to Collect
What it measures: The total cost of your billing operation staff salaries, software, clearinghouse fees, and overhead expressed as a percentage of the revenue that operation collects.
Why it matters: Even a practice with excellent clean claim and collection rates can be unprofitable on the billing side if it costs too much to run. This metric captures the efficiency of the revenue cycle team itself, not just its output.
Benchmark: A cost to collect under 10% is generally considered healthy; many well-run outsourced RCM operations bring this down further through automation and scale.
How to improve it: Automate repetitive tasks like eligibility checks and claim status inquiries, and periodically evaluate whether outsourcing part or all of billing to a specialized RCM partner would lower total cost while improving other KPIs at the same time.
8. Claim Denial Appeal Success Rate
What it measures: Of the denied claims your team chooses to appeal, what percentage are ultimately overturned and paid.
Why it matters: Not every denial is worth appealing, but the ones that are represent real, recoverable revenue. A low appeal success rate suggests either poor documentation in appeals or that your team isn’t prioritizing the denials most likely to be overturned.
Benchmark: Well-run appeal processes can recover a majority of appealed claims, with some organizations reporting success rates as high as 60–65% on the denials they choose to pursue.
How to improve it: Build templated, payer-specific appeal letters backed by clear documentation, and track outcomes by denial reason so your team learns which appeals are worth the effort. Our denial management guide breaks this workflow down in more detail.
9. Point-of-Service (POS) Collection Rate
What it measures: The percentage of patient-responsible charges collected at the time of service, rather than billed afterward.
Why it matters: As high-deductible health plans push more financial responsibility onto patients, POS collections have become one of the fastest ways to improve cash flow and reduce bad debt. Money collected at check-in or checkout never has to go through the far more expensive process of statement billing and follow-up.
Benchmark: There’s no single universal target, but practices should aim to steadily increase this rate year over year a stagnant or declining POS collection rate usually signals unclear cost estimates or front-desk staff hesitant to ask for payment.
How to improve it: Give front-office staff accurate, real-time cost estimates (based on eligibility and benefits data) and train them to have direct, comfortable conversations about payment at the time of the visit.
10. Patient Payment Collection Rate
What it measures: How much of the total patient-responsible balance (after insurance has paid its portion) your practice actually collects.
Why it matters: Patient balances now make up a growing share of total practice revenue. Unlike insurance payments, patient collections require ongoing communication, flexible payment options, and clear billing statements and practices that don’t invest in this often write off far more than they need to.
Benchmark: Top-performing practices collect the large majority of patient balances within 90 days of billing; anything trending well below that deserves attention to your statement and follow-up process.
How to improve it: Offer multiple payment channels (text-to-pay, online portals, payment plans) and send clear, itemized statements early, rather than waiting for a single lump-sum bill after all insurance processing is complete.
11. Charge Capture Accuracy
What it measures: The percentage of billable services actually documented and submitted for reimbursement, versus services performed but never captured on a claim.
Why it matters: Charge capture failures are invisible on most financial reports because there’s no denial or delay to flag them the revenue simply never gets billed at all. This is often the most underestimated source of lost revenue in a practice.
Benchmark: The goal is as close to 100% as operationally possible; even a 2–3% charge capture gap can represent a significant amount of annual revenue for a busy practice.
How to improve it: Reconcile the schedule (appointments seen) against claims submitted on a regular basis, and audit documentation habits among providers who may be under-coding or forgetting to log ancillary services.
12. Accounts Receivable Aging Distribution
What it measures: The breakdown of outstanding A/R across time buckets typically 0–30, 31–60, 61–90, and 90+ days.
Why it matters: Days in A/R gives you a single average number, but the aging distribution shows you the shape of the problem. Two practices can have the same average Days in A/R while one has a healthy, evenly distributed A/R and the other has a dangerous pile of claims sitting past 90 days.
Benchmark: A healthy distribution keeps the large majority of A/R inside the 0–60 day window, with only a small percentage aging past 90 days.
How to improve it: Set aging-bucket targets explicitly (for example, “no more than 15% of A/R over 90 days”) and review the distribution weekly, not just the overall average.
13. Bad Debt Ratio (Write-Off Rate)
What it measures: The percentage of billed revenue that is ultimately written off as uncollectible, rather than adjusted for contractual reasons.
Why it matters: A rising bad debt ratio is often the downstream consequence of weaknesses elsewhere in the cycle insufficient eligibility checks, poor patient communication about balances, or denials that were never worked and eventually became too old to appeal.
Benchmark: There’s meaningful variation by specialty and patient population, but a rising trend over consecutive quarters is the real red flag, regardless of the absolute number.
How to improve it: Address bad debt at its source: better upfront eligibility and estimate accuracy, earlier patient payment conversations, and a denial-management process (see our guide linked above) that prevents claims from aging into write-off territory in the first place.
14. Payer Mix and Payer-Specific Performance
What it measures: The proportion of your revenue coming from each payer type (Medicare, Medicaid, commercial, self-pay), along with each payer’s individual denial rate, Days in A/R, and net collection rate.
Why it matters: Aggregate KPIs can hide serious problems with a single payer. If your overall denial rate looks acceptable but one commercial payer is denying 25% of claims, blending that into a practice-wide average makes the problem invisible until it’s much larger.
Benchmark: Rather than a fixed number, the goal here is parity no single payer’s metrics should dramatically underperform your overall averages.
How to improve it: Build payer-specific dashboards and review them monthly. A sudden shift in one payer’s denial pattern is often the first sign of a credentialing lapse, a contract change, or a new prior-authorization requirement you haven’t adapted to yet.
15. Revenue Cycle Length (Total Cycle Time)
What it measures: The total time elapsed from the moment a patient encounter occurs to the moment that encounter is fully paid and closed out spanning registration, coding, claim submission, adjudication, and any follow-up.
Why it matters: While Days in A/R measures just the receivables portion, total cycle time captures the entire process end to end, including delays that happen before a claim is even submitted (coding backlogs, documentation delays, charge entry lag). It’s the metric that best reflects the overall health and speed of your operations as a whole.
Benchmark: Shorter is better, and the goal is consistency: a cycle time that varies wildly month to month usually points to bottlenecks in one specific stage rather than a uniformly slow process.
How to improve it: Map your entire revenue cycle stage by stage and time each one. Most practices are surprised to find that the biggest delay isn’t with the payer at all it’s in the days between the visit and when the claim is actually coded and submitted.
Bringing These KPIs Together: Building a Simple Dashboard
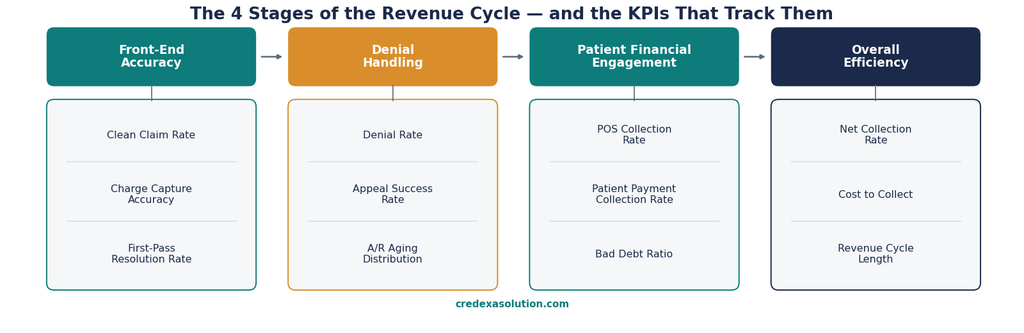
Tracking 15 metrics individually can feel overwhelming, especially for a small or mid-sized practice without a dedicated analytics team. In practice, most of these KPIs feed into a handful of underlying processes:
- Front-end accuracy drives Clean Claim Rate, First-Pass Resolution Rate, and Charge Capture Accuracy.
- Denial handling drives Denial Rate, Appeal Success Rate, and a large share of Days in A/R.
- Patient financial engagement drives POS Collection Rate, Patient Payment Collection Rate, and Bad Debt Ratio.
- Overall efficiency is reflected in Net Collection Rate, Cost to Collect, and Revenue Cycle Length.
A simple monthly dashboard that tracks one or two KPIs from each of these four groups will tell you more about the health of your practice than a dozen disconnected numbers reviewed sporadically. The frameworks published by HFMA’s MAP Keys program and MGMA’s DataDive benchmarking data are excellent starting points if you want to compare your practice against national or specialty-specific norms rather than relying on gut feel alone.
When It’s Time to Get Outside Help
Many practices reach a point where tracking these KPIs reveals problems faster than their in-house team can fix them. That’s a completely normal stage to hit billing has become genuinely more complex, with denial rates rising and payer requirements shifting constantly. If your Days in A/R keeps climbing, your denial rate won’t budge below double digits, or you simply don’t have the bandwidth to build and maintain a proper KPI dashboard, partnering with a dedicated revenue cycle management team can often pay for itself within a few months through recovered denials and faster collections alone.
How Often Should You Review These KPIs?
Not every metric needs the same review cadence. Treating a monthly-review metric like a daily fire drill wastes staff time, while checking a fast-moving number only once a quarter lets small problems compound into large ones.
- Daily or several times a week: Clean Claim Rate and claim rejections at the clearinghouse level. These move fast, and catching a spike in rejections within a day or two rather than a month later can save an entire batch of claims from turning into denials.
- Weekly: Denial Rate by reason code, and your A/R aging distribution. Weekly review is frequent enough to catch a new denial pattern from a specific payer before it becomes a systemic problem.
- Monthly: Days in A/R, Net Collection Rate, Gross Collection Rate, Cost to Collect, First-Pass Resolution Rate, and Charge Capture Accuracy. These are the numbers that belong in a monthly leadership or practice-management meeting.
- Quarterly: Bad Debt Ratio, Payer Mix performance, and Revenue Cycle Length. These metrics move more slowly and are best evaluated as trends over several months rather than reacted to in isolation.
Setting this kind of cadence up front avoids a common trap: reviewing everything constantly, burning out your team on reporting, and still missing the specific number that actually needed attention this week.
Common Mistakes Practices Make When Tracking Billing KPIs
Even practices that track KPIs diligently often undermine the value of that effort in a few predictable ways:
- Looking at averages without segmentation. A practice-wide Denial Rate of 8% might look acceptable, but if it’s actually 2% for Medicare and 22% for one commercial payer, the average is hiding the real problem. Always be ready to slice a KPI by payer, provider, or service line.
- Measuring outcomes without measuring root causes. Knowing that Days in A/R went up tells you something is wrong; it doesn’t tell you what. Pair every top-level KPI with the diagnostic detail behind it denial reason codes, aging buckets, or specific payer performance so a bad number comes with an obvious next step.
- Reviewing KPIs without assigning ownership. A dashboard nobody is accountable for tends to get built once and then ignored. Every KPI on this list should have a specific person or role responsible for watching it and acting when it drifts outside the target range.
- Comparing against generic benchmarks instead of specialty-adjusted ones. A cardiology practice and a family medicine practice will naturally have different baseline Days in A/R and Denial Rates given differences in claim complexity and payer mix. Where possible, use specialty-specific benchmarks from sources like MGMA’s DataDive rather than one-size-fits-all industry averages.
- Treating KPI review as a one-time project. Revenue cycle KPIs aren’t a report you generate once to fix a problem — they’re an ongoing operating rhythm. Practices that sustain improvement are the ones that keep reviewing these numbers long after the initial fire is out.
Frequently Asked Questions
What is the most important medical billing KPI to track first? If you can only track one metric to start, make it Clean Claim Rate. It’s an early indicator that catches problems before they turn into denials or slow payments, and improving it tends to have a positive ripple effect on Days in A/R, First-Pass Resolution Rate, and Net Collection Rate.
How many KPIs should a small practice realistically track? A small or mid-sized practice doesn’t need to actively manage all 15 metrics from day one. Start with the four core metrics Clean Claim Rate, Denial Rate, Days in A/R, and Net Collection Rate and add the rest gradually as your reporting capability matures.
What’s a good denial rate for a medical practice? A denial rate under 5% is considered strong. Rates climbing above 10% typically point to specific, fixable issues such as eligibility verification gaps, coding errors, or missing prior authorizations, and are worth investigating immediately rather than accepting as normal.
How is Days in Accounts Receivable calculated? Days in A/R is generally calculated by dividing total outstanding accounts receivable by the average daily charges (total charges over a period divided by the number of days in that period). The result is the average number of days it takes to collect on a claim after the service date.
Should a practice handle KPI tracking in-house or outsource it? It depends on staff bandwidth and expertise. Practices with a dedicated billing manager and reliable reporting tools can often manage this in-house. Practices that are understaffed, seeing rising denials, or lacking the analytics tools to segment KPIs by payer and provider often see faster, more sustainable improvement by partnering with a specialized revenue cycle management provider.
Final Thoughts
Medical billing KPIs aren’t just numbers for an annual report they’re the earliest warning system your practice has for catching revenue problems while they’re still small and fixable. Start by tracking the fundamentals: Clean Claim Rate, Denial Rate, Days in A/R, and Net Collection Rate. Once those are stable, layer in the rest of the metrics on this list to get a complete, end-to-end view of your revenue cycle’s health.
If coding accuracy or denial management are the areas holding your numbers back, our guides on <a href=”https://credexasolution.com/2026/09/11/cpt-codes-in-medical-billing-the-complete-2026-guide-for-healthcare-providers/”>CPT codes in medical billing</a> and <a href=”https://credexasolution.com/2026/09/11/denial-management-process-in-medical-billing-a-complete-2026-guide-to-preventing-tracking-and-overturning-claim-denials/”>denial management</a> are the natural next step. And if you’d rather have a dedicated team monitor and improve these KPIs for you, Credexa Solutions specializes in exactly that helping practices turn revenue cycle data into faster, more predictable cash flow.
Sources and further reading: HFMA MAP Keys — Revenue Cycle Excellence and MGMA — Foundational Benchmarks and KPIs for Medical Practices offer detailed, regularly updated industry benchmarks for practices that want to go deeper into specialty-specific comparisons.